
Something a bit different today.
If you’ve been reading Uneducated Investor for a while, you know I mostly write about niche corners of the market and long-term investing ideas. But lately, I’ve been spending more time trading Bitcoin — and obsessing over charts that probably don’t belong in this newsletter. So I’ve spun it off.
It’s called Bitcoin Market Report, and it’s where I dig into tactical setups, market maker movements, liquidation maps — the stuff traders care about. If that’s your thing, check out today’s report below. And if you like it, you can sign up for future reports (free, of course).
Bitcoin Market Report
April 19, 2025
BTC Price:
$84,679
Funding Rate:
0.0029% — Mildly elevated, indicating sustained long pressure
Macro Sentiment Overview
Geopolitical noise continues to escalate as Trump intensifies trade measures, adds port fees on Chinese ships, and ramps up regulatory shakeups. Markets remain in a defensive posture, with portfolio rotation into rate-sensitive and defensive names. Bitcoin, meanwhile, has entered an unusually tight holding pattern — a move that feels anything but random.
Top Headlines:
- Trump renews call for interest rate cut, criticizes Fed Chair Powell
- Trump to reclassify federal workers, announces new port fees on Chinese ships
- Volvo to cut 800 U.S. jobs as tariffs bite
Market Structure & Technical Analysis
Let's analyze the charts and see what they tell us.
BTC Liquidation Map – 1D
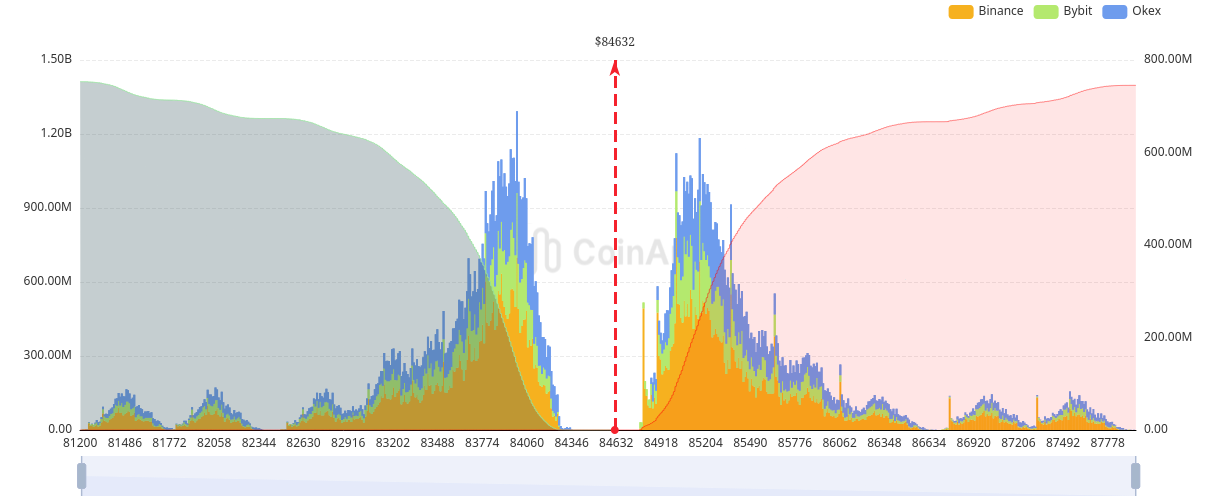
Price has stayed within a tight band for almost a full week — a rare, managed structure that strongly suggests market maker price control. Liquidation liquidity has been allowed to stack on both sides, but there’s a clear imbalance below. The long-liquidation cluster at $82.5K remains dominant, sitting just under $10B. This is likely the magnet if volatility returns.
BTC Liquidation Map – 1W
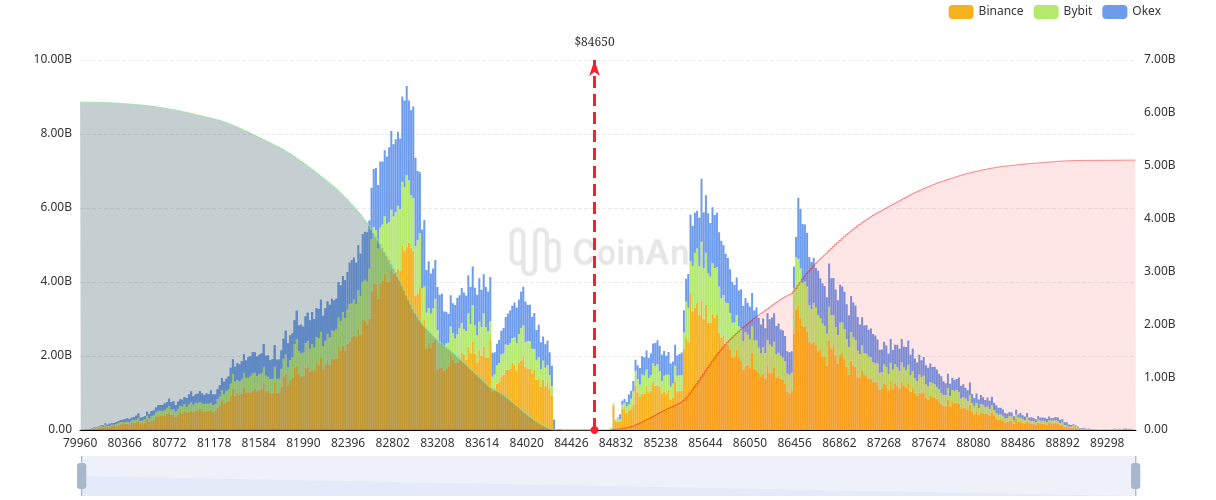
A break below $84K could trigger a swift liquidation cascade.
BTC Heatmap – 1D
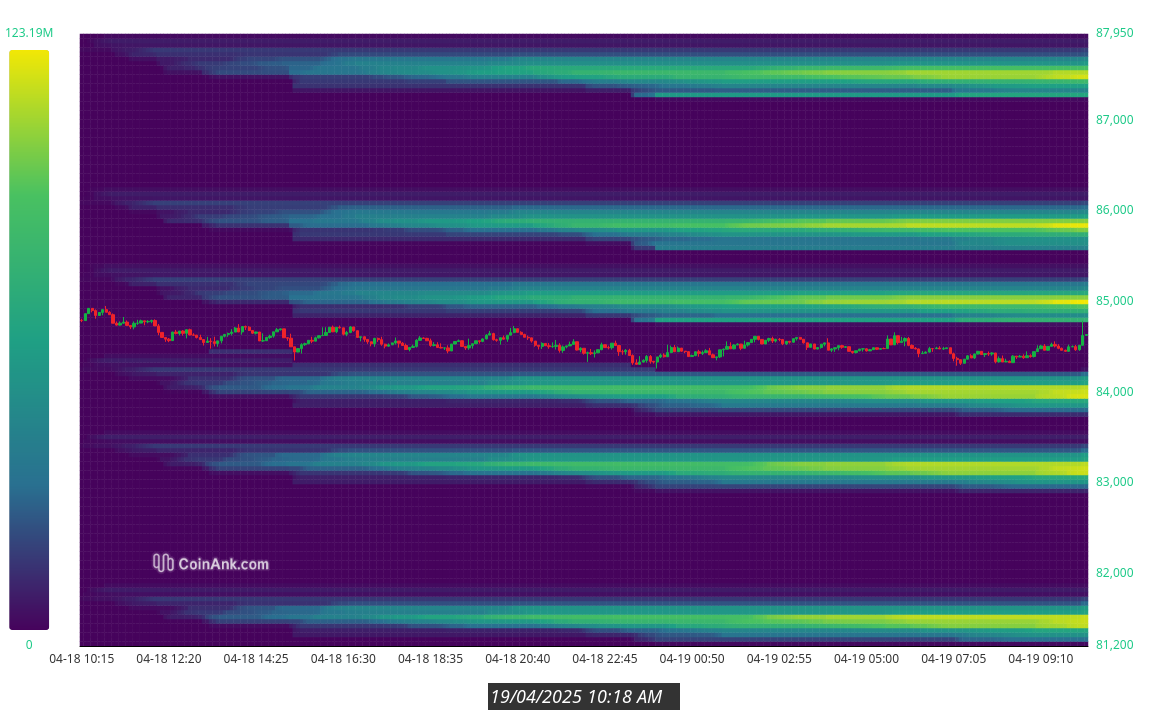
The chart shows what looks like artificial sideways compression — price has been oscillating within a very narrow range for days. Bright yellow liquidity zones have been built up on both sides. This is not natural chop — it’s an engineered coil likely to release into these liquidity pockets.
BTC Heatmap – 1W
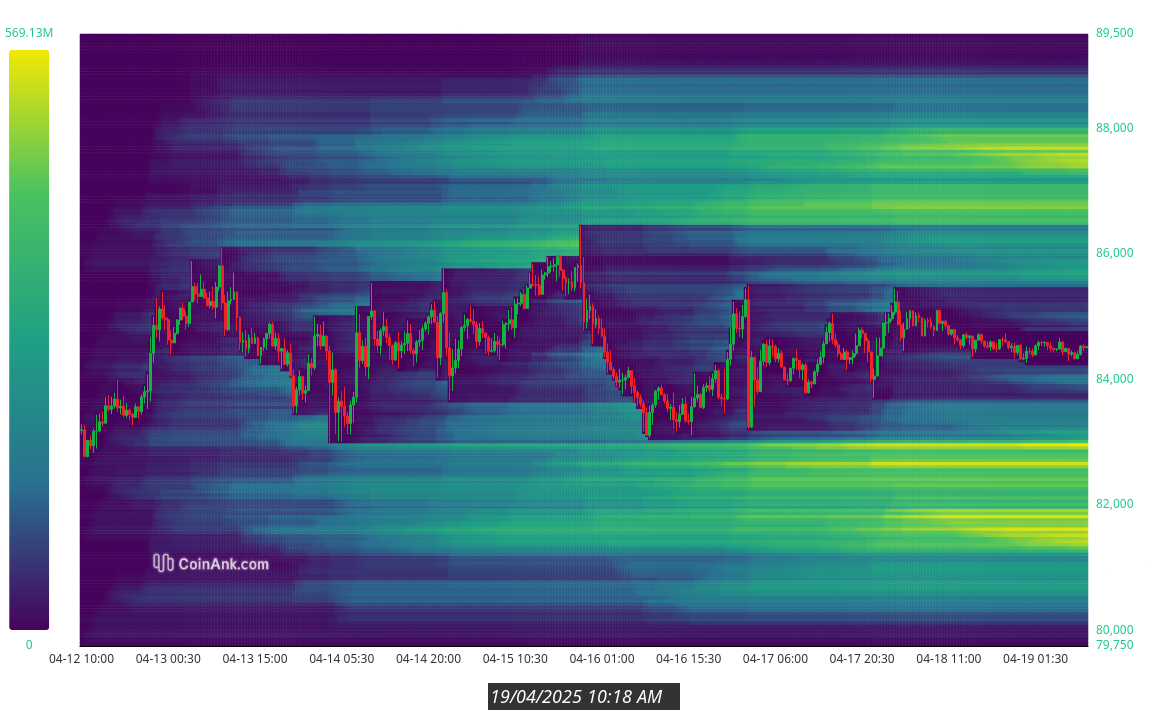
From a broader view, price is trapped under macro resistance with a clear trapdoor forming beneath it. The walls of liquidity above are thin compared to the pit building below — expect volatility once this compressed structure breaks.
BTC CVD (Cumulative Volume Delta)
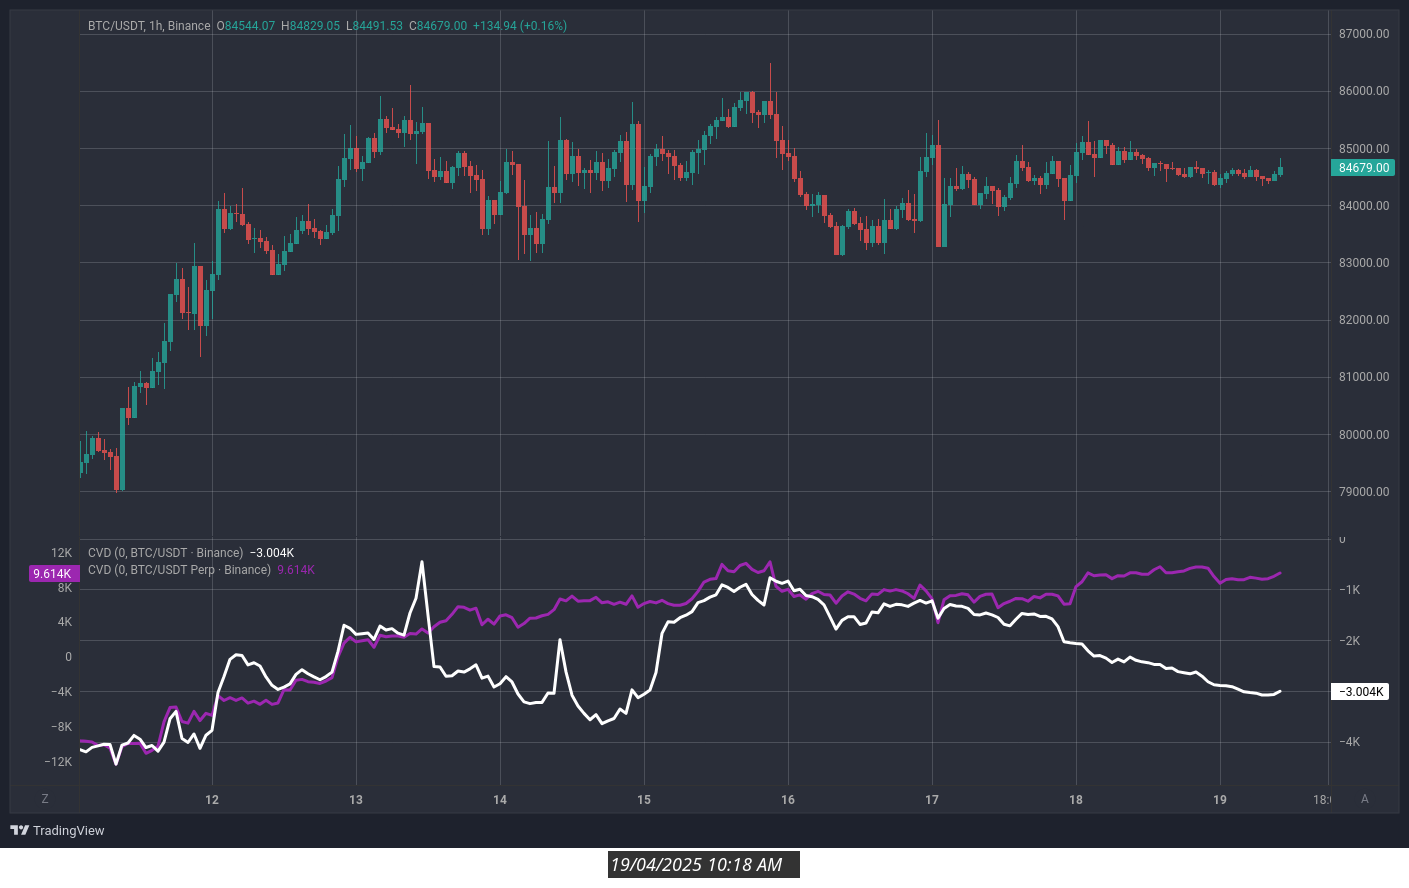
Spot CVD is represented by the white line, while perp CVD is the purple line.
There’s now a strong divergence between spot and perp CVD on the 1H chart. Perp CVD is pinned sideways at the top, while Spot CVD is trending down. This tells us that leveraged buyers are keeping price aloft, while real spot demand is weakening. It’s a classic sign of propped-up price with no organic backing — a setup that typically resolves lower.
BTC Open Interest
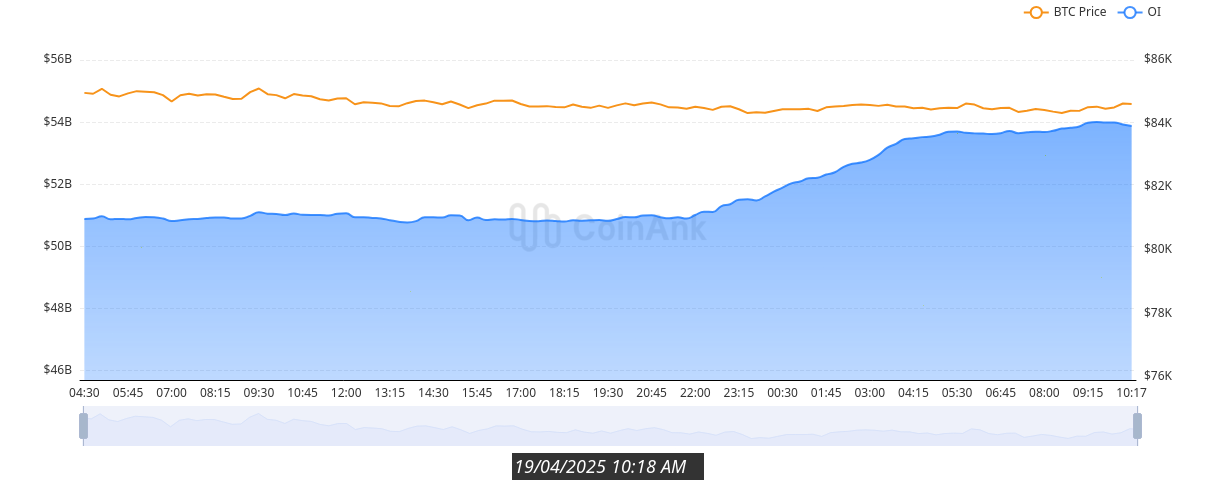
Open Interest has spiked sharply in the past 12 hours — right as price continues to go nowhere. That’s a recipe for a trap setup. Market makers have let traders build positions on both sides, while price does nothing. With OI this elevated and price this stable, the eventual move is likely fast and brutal — with trapped liquidity the primary target.
Trade Idea
Direction: Short
Trigger: Break below $84K with accelerating Spot CVD
Targets: $83K (partial), $82.5K (main), $81K (extension)
Invalidation: Reclaim and hold above $85.8K with strong spot-led bid
Notes: This is a classic market maker coil. The longer price stays still while OI and perp interest climb, the bigger the unwind. CVD divergence confirms spot is not backing the price — it’s being levitated by leverage. Once that leverage unwinds, the move could be swift.
Conclusion
Bitcoin is behaving unnaturally — and that’s the tell. Sideways price action for days while Open Interest climbs and CVD diverges is not indecision — it’s orchestration. Market makers are clearly managing price to build liquidity on both sides, but the larger prize lies below. The $82.5K–$82K long-liquidity cluster (~$10B) is the magnet. With CVD flashing synthetic strength and OI reaching risk-off levels, the next move could be a sharp liquidation flush into those levels.